Debugging a webapp deployed on the WSO2 Application Server can be tiresome at times. The best possible way to achieve this is by remote debugging. Remote debugging is used to debug an application running on a remote server through a local development environment. This is done by starting the application on debug mode then attaching the local development environment to the debug port of the application. This example uses Eclipse for the debugging but this can be done similarly with Intellij Idea as well.
Deploy the webapp on the WSO2 Application Server, then stop the server. In this example an Application Server running on localhost is used.
Step 1: Set up Debug Configurations
- Import the webapp into Eclipse.
- Place breakpoints where needed.
- In Eclipse, go to Run -> Debug Configurations.
- Select Remote Java Application from the left pane then click on the New icon on top.
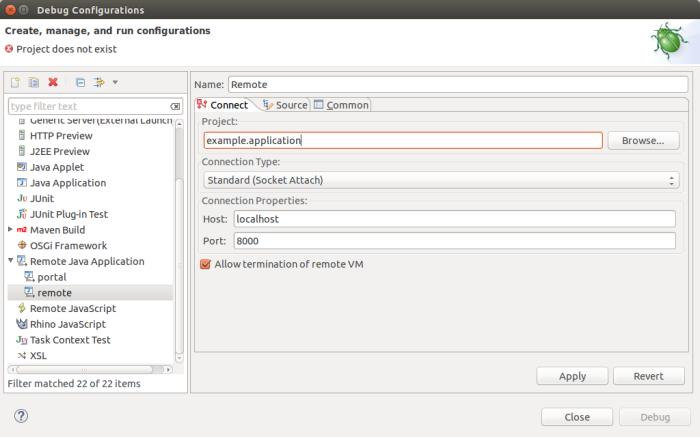
- Select the newly created Debug Configuration, then change the configuration as follows.
- Click on the Browse button then select the project that needs to be debugged.
- Input the Host and Port of the Application Server. Here we shall be using localhost and 8000 as the port.
The configuration is given below.

Step 2: Start the Application Server in Debug Mode
Navigate to <AS_home>/bin from the terminal then start the Application Server on debug mode with the following command.
./wso2server.sh –debug 8000
Here 8000 is the debug port and should be the same as the port given in the debug configuration in Eclipse.
When the server starts listening to the address, start debugging.
Do drop a comment if you have any issues. Have fun!